Have you ever stared at a time series chart, wondering whether a sudden jump or shift is meaningful or just noise? TractionRoad's free Breakpoint Detection Tool helps you decide whether a change in your data is statistically significant or not.
But how does it work? And what are the limitations of the tool? This article explains the statistical background of the tool and how to use it to detect breakpoints in your data.
Breakpoints are sudden changes in your data that happen because of a change in the underlying process generating the data. For example, an increase in sales could be due to a new marketing campaign or a change in customer behavior.
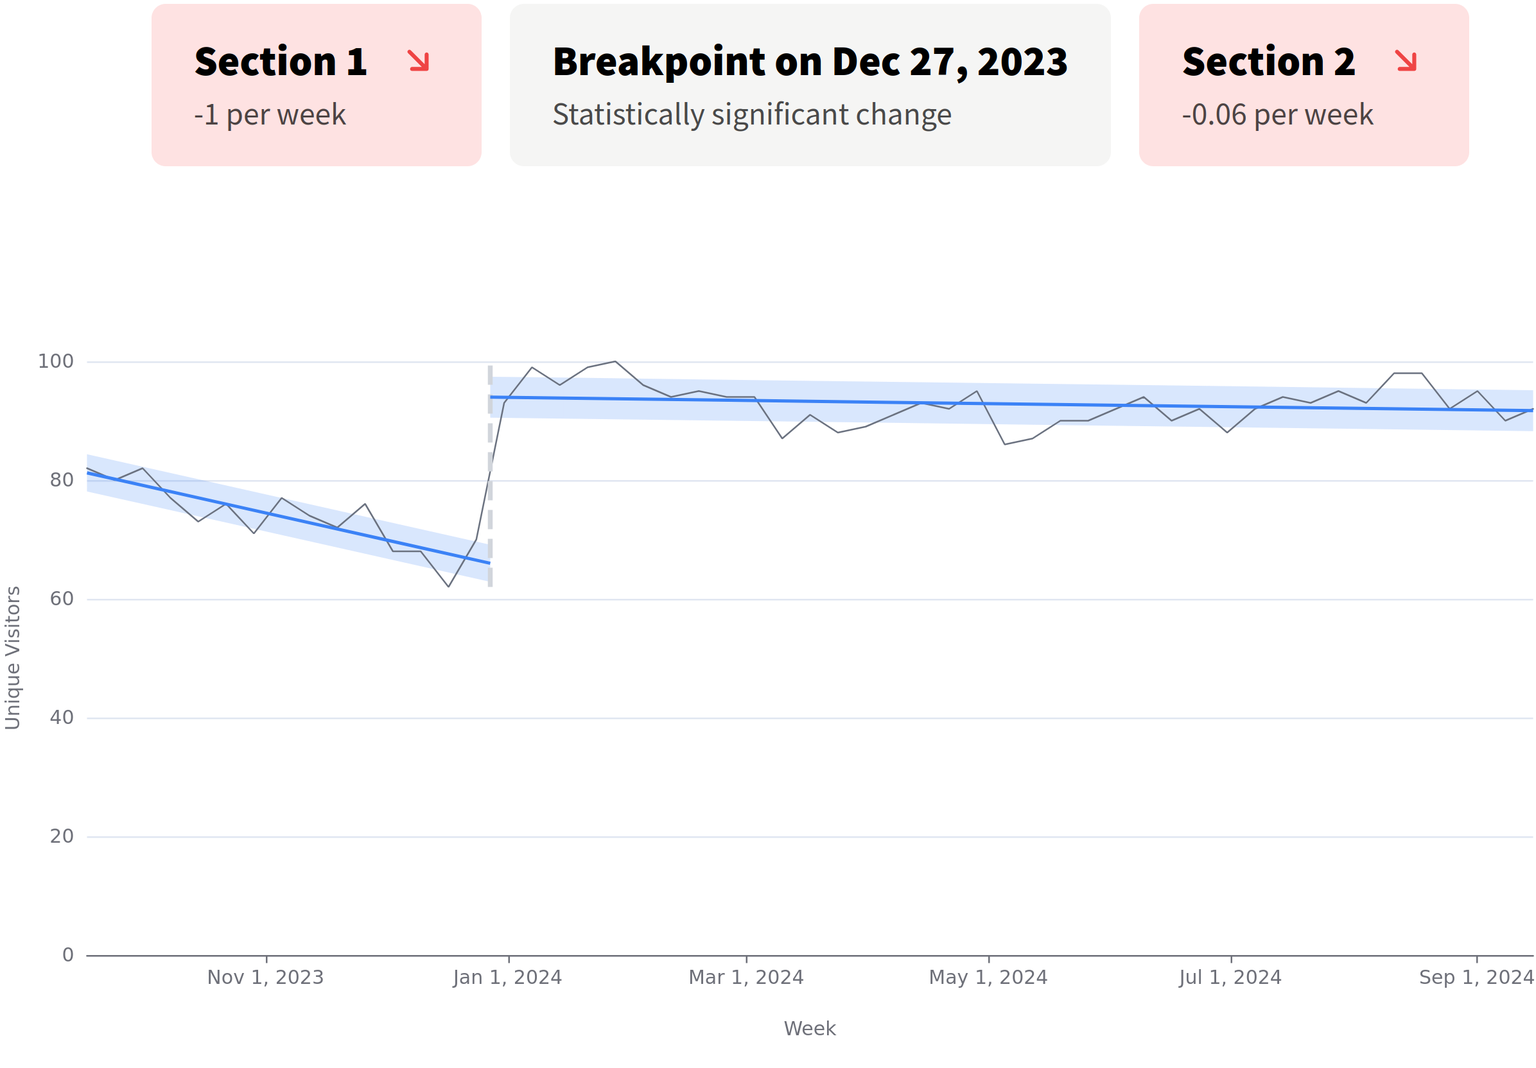
In the chart above the breakpoint is a sudden jump of searches around January 1st. People are making new year's resolutions and are suddenly searching for gym memberships. Throughout the year the search volume drops again.
Or, if you're measuring the flow of a river, a sudden drop in the water level could be due to a dam being built upstream.
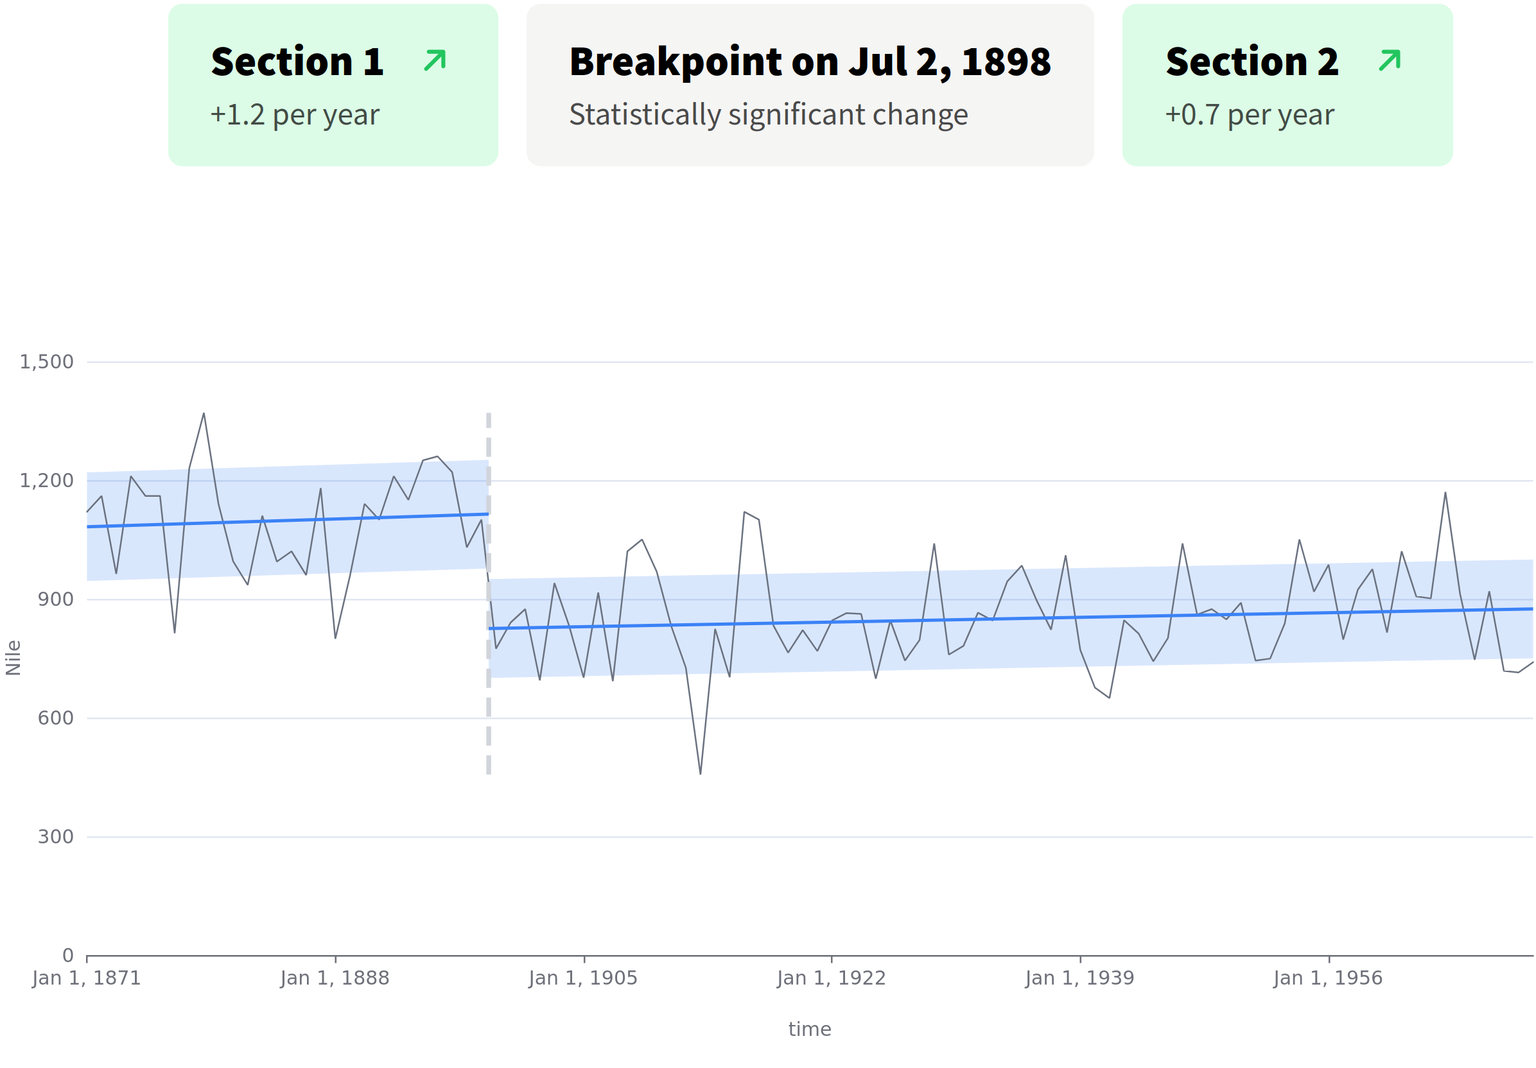
In this case the breakpoint is a sudden shift in the level of the river because of the upstream dam.
However, some fluctuations look like changes but are just noise. These are random fluctuations that don't reflect any real change in the underlying process.
If you make decisions based on a breakpoint you found in your data, you want to be sure that the change is real and not just looks like a change.
This is where our in-browser Breakpoint Detection Tool can help. It tries to find a breakpoint in your data and then tests whether the change is statistically significant or not.
The Breakpoint Detection Tool first fits a single linear regression to your data. This is the simplest model that assumes a constant slope over the entire time period.
Then it splits your data at different points in time and fits two different linear regressions to the two parts. One linear regression for the data before the split and one for the data after the split.
The tool then compares the fit of the two linear regressions for all the possible splits and selects the best split as a candidate for a breakpoint.
At this point it's not yet clear whether the change is real or just noise. We only know that there is a change in the data that is best explained by two different linear models. But we still need to test whether the change is statistically significant.
To test whether the change is statistically significant, the tool uses a statistical test called the Chow test. The Chow test compares the fit of the single linear regression model with the fit of the two linear regression models before and after the breakpoint.
Simply put, the Chow test checks whether the change (either a jump in level or a change in slope) is large enough compared to the noise in your data.
In more technical terms, we define as our null hypothesis that there is no breakpoint at candidate point in your data. And the alternative hypothesis is that there is a breakpoint. The Chow test then calculates the probability of observing the change in the data if the null hypothesis is true. If this probability is low enough, we reject the null hypothesis and conclude that the change is statistically significant.
The Breakpoint Detection Tool uses a significance level of 0.05. This means that there's a 5% chance of finding a breakpoint in your data even if there is no real change. This is a common threshold in statistics and is used to balance the risk of missing a real change with the risk of finding a change that isn't there.
The Breakpoint Detection Tool is a great tool to detect breakpoints in your data. However, statistics is tricky and it has some limitations that you should be aware of.
The more places you test for a breakpoint, the higher the chance of finding one just by chance. Let's look at an example.
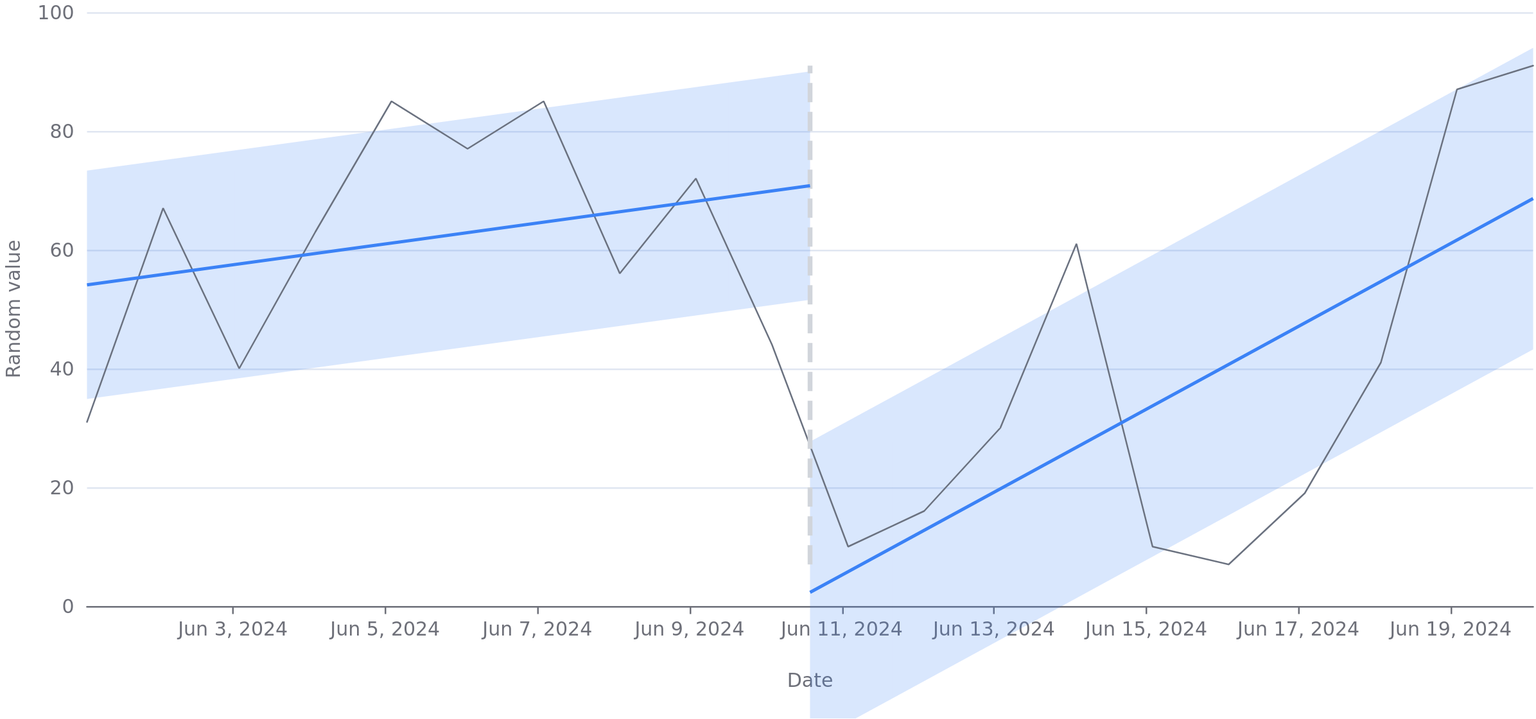
The following data is just random variation around a mean value. But our tool finds a breakpoint because the purely random variation just lined up in the right way.
Is this a problem? It depends. The probability of finding a wrong breakpoint is definitely elevated with this approach. But here is a strategy to mitigate that.
If you suspect a breakpoint at a specific point, try the tool and see if it finds the same place. If it does, you can be more confident that the change is real. If it doesn't, you might be looking at something that only looks like a change.
The Breakpoint Detection Tool assumes that your data points (more specifically the difference to the linear regression model) are independent of each other. This means that the value of one data point shouldn't depend on the values of the previous data points. Time series data often violates this assumption because the value of a data point is often related to the value of the previous data point.
The Breakpoint Detection Tool assumes that the data is generated by a linear process. This would mean that the data is generated by a process that has a constant slope over time.
If your data has a seasonal pattern, the tool might find breakpoints for something that's better described as a recurring pattern. For example, if you're measuring sales data, you might see a weekly pattern where sales are higher during the workweek and lower on weekends.
The Chow test assumes that the residuals of the linear regression models are normally distributed. This means that the residuals should be symmetrically distributed around zero. If your data has a different distribution, the statistical test might not be valid.
We'll probably add more tests in the future to account for these limitations. Subscribe to the newsletter below to hear when we add new features to the tool.
The Breakpoint Detection Tool is a useful tool to quickly detect and test for a breakpoint in your data. It'll help you decide whether a change in your data could be real or is just noise.
However, statistics is tricky and the tool has some limitations. Be aware of these limitations and use the tool as a guide that's better than looking at a graph and guessing.
If you suspect a breakpoint in your data, try the tool and see what it finds. But always remember that the tool is just a tool and not a substitute for critical thinking and domain knowledge.
Definitely subscribe to our newsletter below to hear when we add more rigorous tests to the tool and add our next tool for marketers.
If you have any questions or feedback, please reach out to us at support@tractionroad.com.
